

Solar energy has become the cornerstone of South Africa's renewable energy transition, yet questions about its environmental credentials persist. Understanding the solar panel carbon footprint requires examining the complete lifecycle of photovoltaic systems, from raw material extraction through manufacturing, installation, operation, and eventual recycling. For commercial and industrial decision-makers evaluating energy investments in 2026, this comprehensive analysis reveals how modern solar technology delivers substantial net carbon reductions despite the upfront emissions associated with panel production.
Understanding the Solar Panel Carbon Footprint Lifecycle
The carbon footprint of solar photovoltaic systems encompasses emissions at every stage of their existence. Manufacturing accounts for the majority of lifetime emissions, whilst operational phases generate virtually zero direct greenhouse gases.
Manufacturing emissions include extraction of raw materials (particularly silicon, aluminium, and glass), energy-intensive purification processes, wafer production, cell fabrication, and module assembly. Each step requires significant energy input, and the carbon intensity varies dramatically depending on the electricity source powering these facilities.
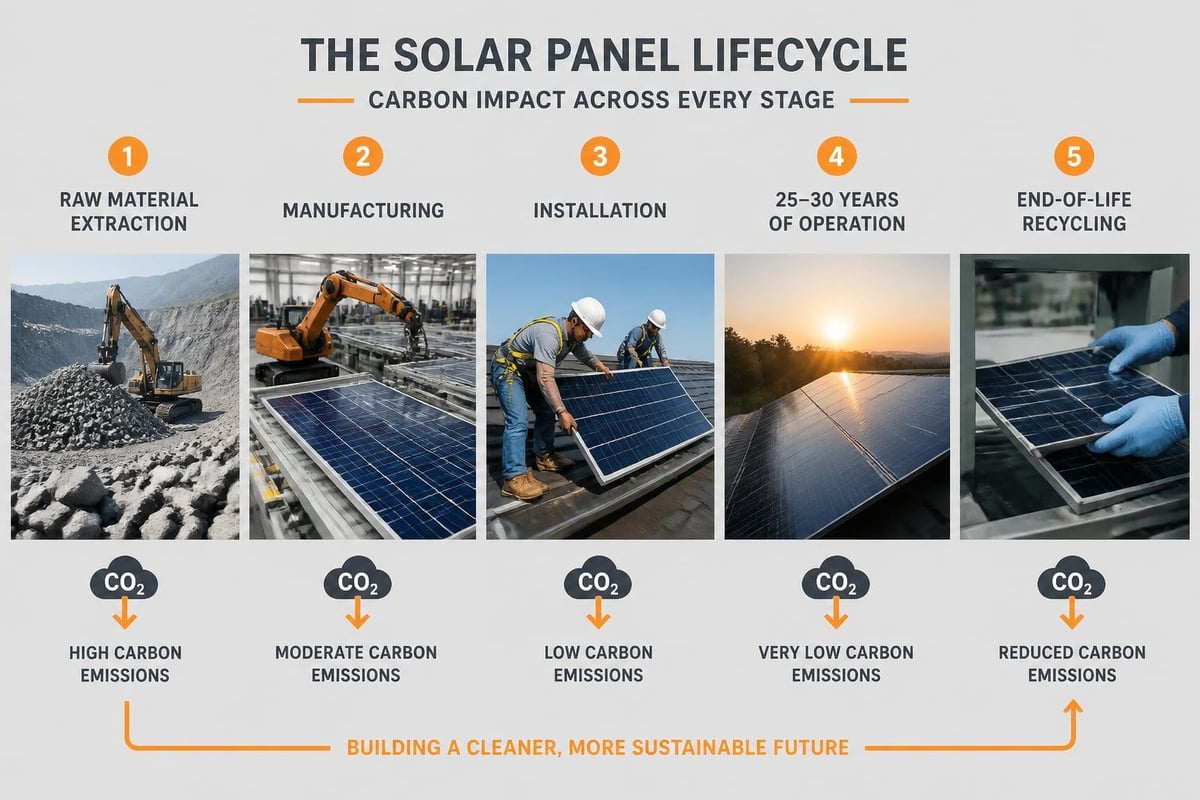
Research published in Nature Communications demonstrates that manufacturing location profoundly impacts carbon intensity. Panels produced in regions with coal-heavy grids carry emissions up to three times higher than those manufactured using renewable electricity.
Manufacturing Phase Emissions Breakdown
| Lifecycle Stage | Percentage of Total Carbon | Key Contributing Factors |
|---|---|---|
| Silicon purification | 35-45% | High-temperature processing, electricity source |
| Cell production | 25-30% | Energy-intensive fabrication, chemical inputs |
| Module assembly | 15-20% | Glass production, aluminium frames, transport |
| Balance of system | 10-15% | Inverters, mounting structures, wiring |
Modern monocrystalline panels typically generate 30-50 grams of CO₂ equivalent per kilowatt-hour (gCO₂eq/kWh) over their operational lifetime, according to data from the IEA Photovoltaic Power Systems Programme. This figure represents a dramatic improvement from early solar technology, which exceeded 100 gCO₂eq/kWh.
Transport emissions, whilst significant, contribute less than many assume. Shipping panels from Asian manufacturers to South African ports adds approximately 2-5 gCO₂eq/kWh to the total footprint, a relatively modest proportion when amortised across 25-30 years of operation.
Manufacturing Improvements Reducing Carbon Intensity
The solar industry has achieved remarkable progress in reducing the carbon intensity of panel production. Between 2011 and 2026, the solar panel carbon footprint per watt of capacity has declined by approximately 60%, driven by several simultaneous advances.
Energy efficiency gains in manufacturing processes have cut electricity consumption per panel by nearly half. Modern production facilities use advanced automation, heat recovery systems, and optimised process flows that minimise waste energy.
Panel efficiency improvements mean that each square metre generates more electricity over its lifetime, effectively spreading the manufacturing carbon across more useful energy output. Today's commercial panels regularly exceed 21% efficiency, compared to 15% efficiency common in 2015.
- Thinner wafers reduce silicon consumption and processing energy
- Diamond wire sawing cuts silicon waste from 50% to under 20%
- Continuous manufacturing eliminates energy-intensive batch processes
- Renewable factory power directly lowers Scope 2 emissions
The shift toward manufacturing powered by renewable energy represents perhaps the most significant reduction pathway. Fraunhofer ISE research indicates that panels produced using 100% renewable electricity carry approximately 40% lower carbon footprints than those manufactured on coal-heavy grids.
For Southern African buyers, this manufacturing location question matters. Panels sourced from European manufacturers increasingly use renewable electricity, whilst Asian production remains mixed, with some facilities transitioning to cleaner energy and others still reliant on coal.
Carbon Payback Period: When Solar Becomes Carbon Negative
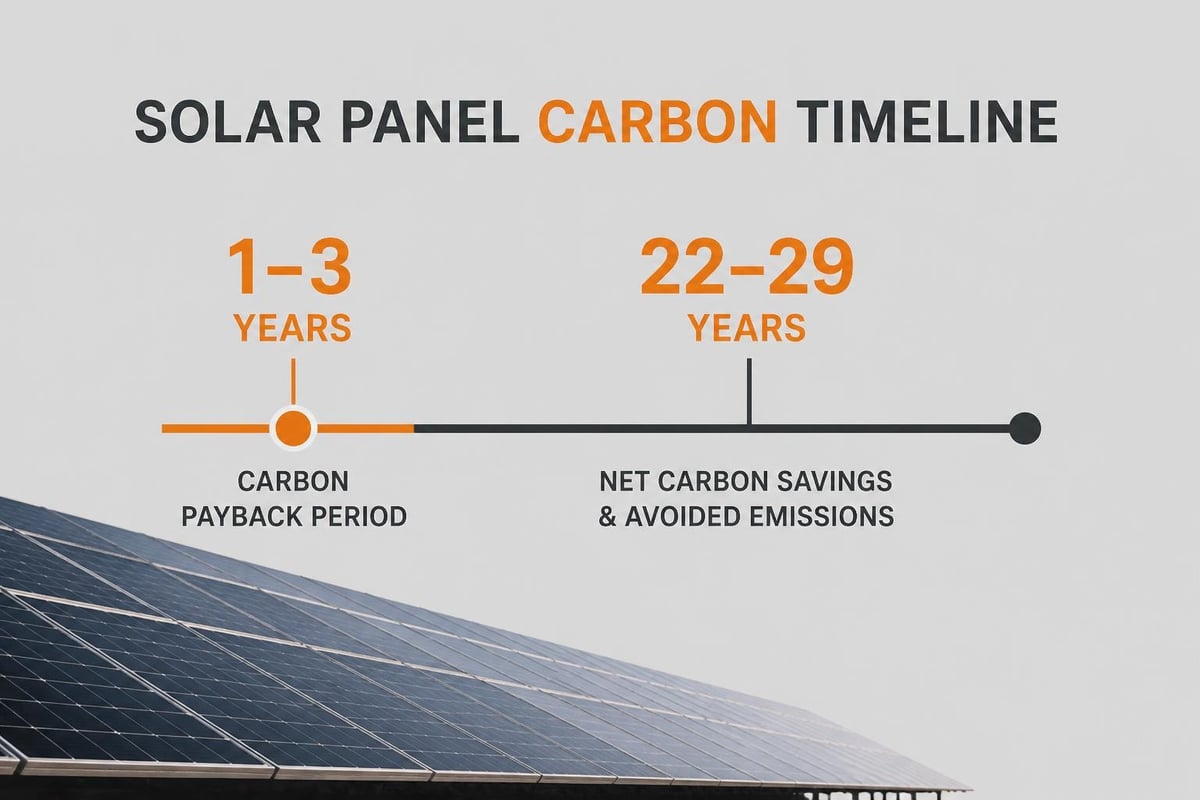
The carbon payback period represents the time required for a solar installation to generate enough clean electricity to offset the emissions created during manufacturing, transport, and installation. This metric provides crucial perspective on the solar panel carbon footprint debate.
South African Carbon Payback Analysis
In South Africa's current electricity context, solar PV systems achieve carbon payback remarkably quickly due to the high carbon intensity of grid electricity, which remains dominated by coal-fired generation.
Typical payback periods for commercial installations range from 1.5 to 3 years, depending on:
- Panel manufacturing location and process efficiency
- System size and configuration (larger systems benefit from economies)
- Installation type (rooftop, ground-mount, carport)
- Local solar resource (irradiation levels across South Africa)
- Displaced grid electricity carbon intensity
A commercial rooftop installation in Johannesburg typically achieves carbon payback within 2.2 years, after which it delivers 23-28 years of net carbon reduction. The same system in Cape Town might take 2.5 years due to slightly lower average irradiation, whilst installations in the Northern Cape can achieve payback in under 2 years.
The calculation compares manufacturing and installation emissions (typically 400-800 kg CO₂eq per installed kW) against avoided emissions from displaced grid electricity (approximately 900-950 gCO₂eq per kWh in South Africa). This comparison highlights why solar PV delivers exceptional climate value in coal-dependent grids.
IPCC assessments consistently rank solar photovoltaics among the lowest lifecycle emission technologies for electricity generation, with median values below 50 gCO₂eq/kWh compared to 820 gCO₂eq/kWh for coal and 490 gCO₂eq/kWh for natural gas.
Operational Phase: Minimal Ongoing Emissions
Once installed and commissioned, solar PV systems generate electricity with virtually zero direct greenhouse gas emissions. This operational characteristic fundamentally distinguishes renewable technologies from fossil fuel generation.
Maintenance activities contribute minimal carbon over the system lifetime. Periodic cleaning, occasional component replacement, and monitoring infrastructure add approximately 1-3 gCO₂eq/kWh across 25-30 years of operation.
Inverter replacement, typically required once during system life, contributes the largest operational carbon component. Modern string inverters embody approximately 50-80 kg CO₂eq per unit, whilst central inverters for large commercial systems can represent 200-400 kg CO₂eq.
Remote monitoring systems, increasingly standard on commercial solar installations, consume negligible electricity and enable performance optimisation that maximises carbon displacement over system life.
Comparing Operational Emissions Across Technologies
| Generation Technology | Lifecycle Emissions (gCO₂eq/kWh) | Operational Emissions |
|---|---|---|
| Coal (SA average) | 820-950 | Very high (fuel combustion) |
| Natural gas combined cycle | 450-550 | High (fuel combustion) |
| Solar PV | 30-50 | Near zero |
| Wind | 10-15 | Near zero |
| Nuclear | 12-20 | Near zero |
The distinction between lifecycle and operational emissions matters critically when evaluating energy transitions. Whilst solar carries manufacturing emissions, it displaces ongoing fuel combustion emissions every single day of operation.
Balance of System Components and Their Carbon Contribution
Photovoltaic modules represent only part of the total system carbon footprint. Balance of system (BoS) components, including inverters, mounting structures, electrical infrastructure, and monitoring systems, contribute approximately 15-25% of total lifecycle emissions.
Inverter carbon footprint varies by type and capacity. String inverters for commercial systems embody 40-60 kg CO₂eq per kW of capacity, whilst central inverters achieve better carbon efficiency at 30-45 kg CO₂eq per kW due to economies of scale.
Mounting structures depend heavily on installation type:
- Rooftop ballasted systems minimise structural materials and embodied carbon
- Ground-mount installations require steel or aluminium racking and foundations
- Carport structures incorporate significant additional structural steel
Aluminium frames contribute substantially to module carbon footprints. Producing aluminium requires approximately 8-12 tonnes of CO₂ per tonne of material, making frame design and recycling important considerations. Some manufacturers now use recycled aluminium content exceeding 50%, reducing this component's footprint by approximately 40%.
Copper wiring and electrical infrastructure add relatively modest emissions when amortised across large commercial installations. A 500 kW commercial system might use 1,500-2,000 kg of copper, contributing approximately 10,000-15,000 kg CO₂eq, or roughly 2-3% of total system lifecycle emissions.
End-of-Life Considerations and Circular Economy Approaches
The solar panel carbon footprint extends through decommissioning and disposal or recycling. How the industry manages end-of-life solar equipment increasingly influences net lifecycle emissions and circular economy outcomes.
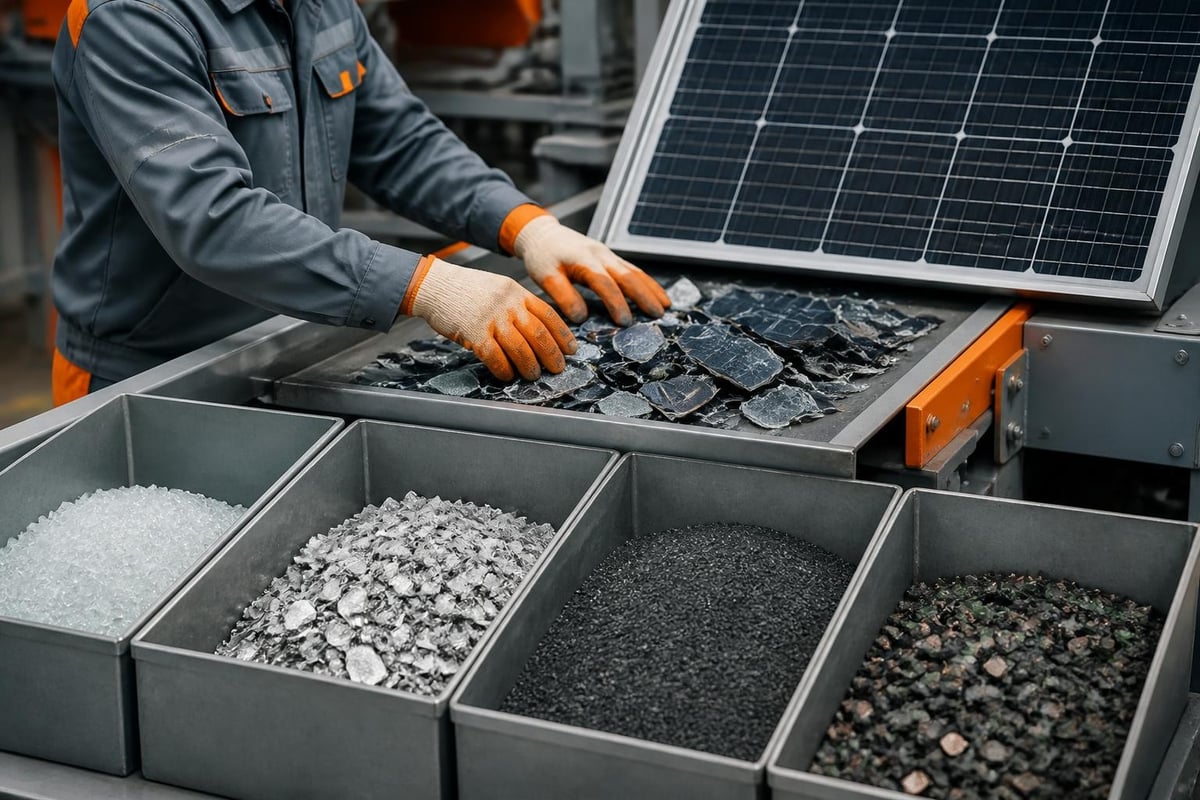
Modern solar panels remain functional for 25-30 years, but Southern Africa will face growing volumes of retired panels from 2030 onwards as early installations reach end-of-life. IRENA projections estimate that cumulative global waste could reach 78 million tonnes by 2050, creating both environmental challenges and resource recovery opportunities.
Recycling benefits extend beyond waste diversion. Recovering materials from retired panels avoids the carbon emissions associated with virgin material extraction and processing. Glass recycling saves approximately 25% of manufacturing emissions, whilst aluminium recovery avoids up to 95% of primary production emissions.
| Recoverable Material | Typical Panel Content | Carbon Saving Through Recycling |
|---|---|---|
| Glass | 70-75% | 25% of virgin production |
| Aluminium (frame) | 10-12% | 95% of virgin production |
| Silicon | 3-5% | 60% of virgin production |
| Copper | 1-2% | 85% of virgin production |
| Silver/rare materials | <1% | Variable, high value |
South Africa currently lacks comprehensive solar panel recycling infrastructure, though this represents both a challenge and an opportunity. Companies establishing solar recycling capabilities position themselves favourably as regulatory frameworks evolve and circular economy principles gain traction.
Extended Producer Responsibility (EPR) schemes, increasingly common in European markets, require manufacturers to fund end-of-life management. Whilst South Africa has not yet implemented solar-specific EPR, precedents in electronic waste and packaging suggest similar frameworks may emerge by 2030.
Regional Variations in Solar Panel Carbon Footprint
Geographic location influences both the emissions embodied in solar systems and the carbon benefits they deliver. For Southern African installations, several regional factors shape the net carbon outcome.
Solar resource quality directly affects lifetime energy generation and carbon intensity. South Africa's Northern Cape province receives approximately 2,800 kWh/m²/year of solar irradiation, amongst the world's highest levels. Systems in this region generate more electricity per installed watt, spreading manufacturing emissions across greater useful output.
Coastal areas experience slightly lower irradiation (1,800-2,200 kWh/m²/year) but still deliver excellent carbon performance. Even in less optimal locations, the carbon payback period rarely exceeds 3.5 years.
Grid carbon intensity varies regionally due to transmission constraints and local generation mix. Displacing Eskom coal generation delivers greater carbon benefit than displacing hypothetical gas or renewable generation, making South African solar particularly valuable from a climate perspective.
Transport emissions depend on project location and equipment origin. A Johannesburg installation sourcing panels from Durban port adds minimal transport carbon (approximately 50-100 km by road), whilst remote sites in the Northern Cape or Limpopo might add 500-800 km of overland transport, increasing footprint by roughly 2-4 gCO₂eq/kWh.
Installation conditions affect embodied emissions through concrete foundations, access roads, and site preparation. Brownfield rooftop installations on existing industrial facilities minimise these impacts, whilst greenfield ground-mount projects in undeveloped areas require additional site work and associated emissions.
Technology Advances Shaping Future Carbon Performance
The solar industry's carbon intensity continues declining as technology advances and manufacturing processes improve. Several developments in 2026 promise further reductions in the solar panel carbon footprint over the coming decade.
Bifacial module adoption increases energy yield by capturing reflected light on rear-facing cells, improving carbon intensity by 5-15% without additional manufacturing emissions. Southern African installations with reflective surfaces (white roofing, light-coloured ground cover) benefit particularly from this technology.
Tandem and multi-junction cells promise efficiency gains beyond current silicon limitations. Perovskite-silicon tandems approaching commercial viability could achieve 30%+ efficiency, reducing the material and carbon cost per watt of capacity by approximately 20-30%.
- Heterojunction technology improves efficiency whilst reducing processing temperatures
- Half-cut cell designs minimise resistive losses and improve performance
- Module-level power electronics optimise generation in partial shade conditions
- Passivated emitter rear contact (PERC) cells increase efficiency without significant carbon penalty
Manufacturing automation continues reducing energy consumption and waste. Facilities commissioned in 2026 use approximately 35% less energy per panel than comparable plants from 2020, driven by process optimisation, waste heat recovery, and artificial intelligence control systems.
The transition toward renewable-powered manufacturing facilities accelerates globally. Several major manufacturers have committed to 100% renewable electricity by 2030, which would reduce panel carbon footprints by 25-40% compared to current coal-heavy production.
Integrating Carbon Considerations into Procurement Decisions
Commercial and industrial buyers evaluating solar investments should incorporate carbon footprint analysis alongside financial metrics. This integrated approach aligns with ESG reporting requirements and Net Zero commitments increasingly common amongst South African corporates.
Environmental Product Declarations (EPDs) provide standardised lifecycle assessment data for solar equipment. Requesting EPDs during procurement enables direct comparison of carbon performance across manufacturers and product lines.
Procurement criteria might include:
- Maximum lifecycle carbon intensity thresholds (e.g., <45 gCO₂eq/kWh)
- Manufacturing energy sources (preference for renewable-powered facilities)
- Recycled content in aluminium frames and other components
- End-of-life take-back programmes and recycling commitments
- Supply chain transparency regarding carbon accounting
Combining solar installations with battery energy storage affects total system carbon footprint. Lithium-ion batteries add approximately 60-120 kg CO₂eq per kWh of storage capacity, but enable higher self-consumption of solar generation, displacing additional grid electricity and improving overall carbon outcomes.
The EPA's AVERT tool methodology, whilst designed for United States grids, illustrates how calculating avoided emissions depends on which generation sources solar displaces. In South Africa's context, solar displaces primarily coal and to a lesser extent diesel generation from backup systems, maximising carbon benefits.
Projects incorporating comprehensive monitoring through energy management systems optimise performance over system life, ensuring maximum carbon displacement. A system operating at 95% of design performance due to monitoring and maintenance delivers 5% greater lifetime carbon savings than a degraded, poorly maintained installation.
Regulatory and Reporting Framework Considerations
South Africa's evolving carbon regulatory landscape increasingly influences how organisations account for and report the solar panel carbon footprint within their broader sustainability frameworks.
Greenhouse Gas Protocol standards provide the international framework for corporate carbon accounting. Solar installations affect multiple scopes:
- Scope 1: No direct impact (solar generates no on-site combustion)
- Scope 2: Reduces purchased grid electricity and associated emissions
- Scope 3: Manufacturing and disposal occur in supplier value chain
The Carbon Tax Act, implemented in 2019 and progressively increasing, creates financial incentives for emissions reduction. Whilst solar installations themselves avoid direct tax liability, they reduce facility-level emissions and associated compliance costs for energy-intensive operations.
| Reporting Standard | Solar PV Treatment | Key Considerations |
|---|---|---|
| GHG Protocol | Scope 2 reduction | Market vs. location-based accounting |
| CDP Climate | Renewable energy adoption | Methodology transparency |
| TCFD | Climate risk mitigation | Physical and transition risk |
| GRI Standards | Energy consumption | Renewable percentage disclosure |
Section 12B tax incentives for energy efficiency complement but don't directly apply to solar generation. However, combined strategies incorporating solar alongside efficiency measures optimise both financial returns and carbon reduction outcomes.
Future carbon border adjustment mechanisms, under discussion in European markets, may eventually influence South African exports. Products manufactured using renewable electricity carry lower embedded carbon, potentially avoiding border carbon charges that could affect competitiveness in climate-conscious markets.
Understanding the complete solar panel carbon footprint demonstrates that photovoltaic systems deliver substantial net environmental benefits despite manufacturing emissions, typically achieving carbon payback within 1.5-3 years in South African conditions and providing 22-29 years of carbon-free electricity generation. For organisations pursuing meaningful carbon reduction alongside energy cost savings and resilience, solar PV represents a proven technology with improving environmental performance. INFOLED combines deep renewable energy engineering expertise with comprehensive lifecycle understanding to design, install, and maintain solar systems that maximise both financial returns and carbon displacement across commercial, industrial, and agricultural applications throughout Southern Africa.
Next Step
Need help with your energy strategy?
Speak to INFOLED about solar, storage, EV charging, service agreements or system performance.