
The renewable energy sector has transformed dramatically over the past decade, yet one persistent challenge remains: accurately predicting how much power your solar panels or wind turbines will actually generate. This is where the renewable ninja platform has emerged as an indispensable tool for energy professionals, developers, and businesses across Southern Africa. By providing access to validated, hourly renewable energy generation data spanning decades, this sophisticated web tool enables stakeholders to make informed decisions about solar PV installations, wind farm development, and hybrid energy system design with unprecedented precision.
Understanding the Renewable Ninja Platform
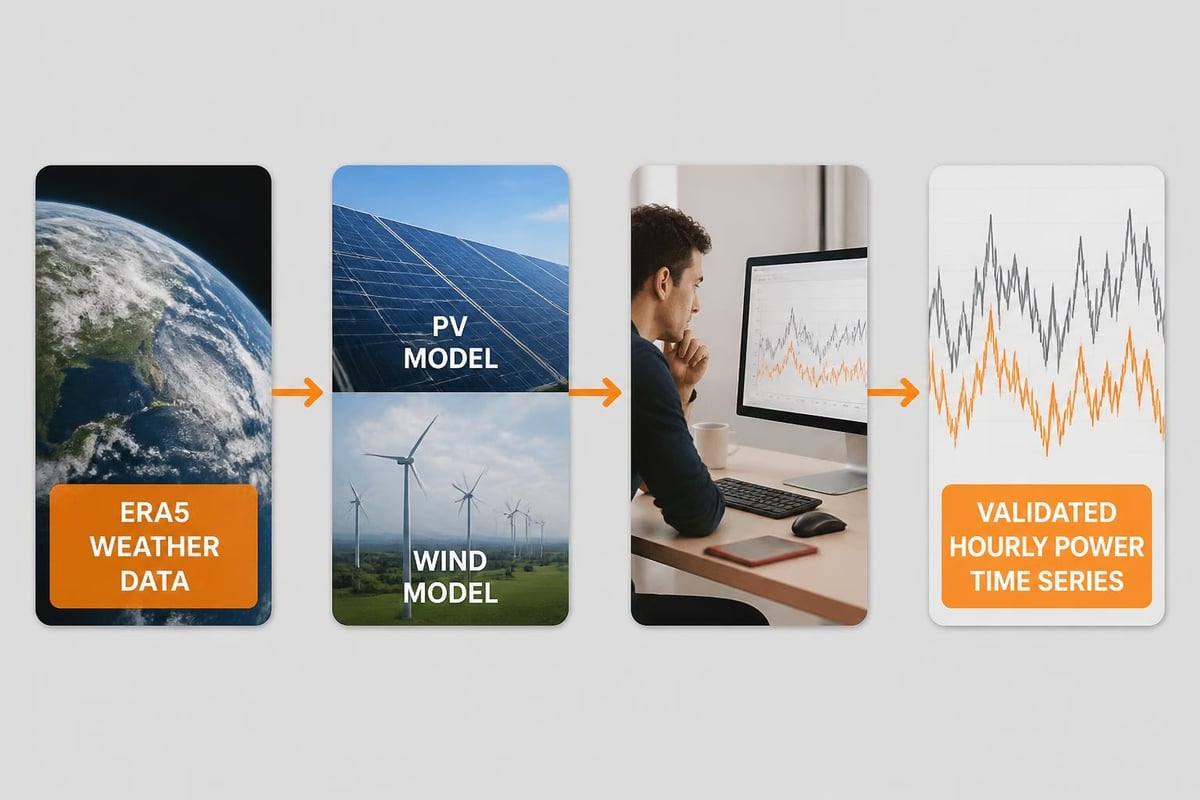
The renewable ninja is fundamentally a simulation tool that converts historical weather data into realistic renewable energy generation profiles. Rather than relying on simplified assumptions or generic production estimates, the platform uses decades of meteorological reanalysis data to model exactly how solar panels or wind turbines would have performed at any location worldwide.
At its core, the platform draws upon the ERA5 reanalysis dataset maintained by the European Centre for Medium-Range Weather Forecasts. This dataset provides hourly weather variables at high spatial resolution, capturing everything from solar irradiance and cloud cover to wind speeds and temperature variations. The renewable ninja takes this raw meteorological data and applies sophisticated physical models to simulate power output from renewable installations.
Key Features and Capabilities
What distinguishes the renewable ninja from basic solar calculators is its depth and flexibility:
- Hourly resolution data spanning multiple decades
- Location-specific simulations for any coordinate globally
- Multiple technology options including various PV panel types and wind turbine models
- Customizable system parameters such as capacity, tilt angles, and tracking configurations
- Direct data export in CSV or JSON formats for integration into financial models
- API access for programmatic retrieval and automation
The official documentation provides comprehensive guidance on methodology, validation studies, and appropriate use cases. For South African developers evaluating solar installations in Johannesburg or wind potential along the Eastern Cape coast, this level of granularity proves invaluable.
Practical Applications in South Africa's Energy Transition
South Africa's energy landscape presents unique challenges that make tools like the renewable ninja particularly valuable. Load shedding continues to disrupt businesses, while the country's abundant solar and wind resources remain underutilized. Accurate generation forecasting enables better system sizing, storage integration, and financial planning.
Solar PV System Design and Validation
When designing commercial or industrial solar installations, sizing systems appropriately requires understanding real-world performance patterns. Generic estimates often assume uniform daily production, but actual output varies significantly based on seasonal weather patterns, cloud coverage, and atmospheric conditions.
Using the renewable ninja, engineers can simulate how a proposed 500 kW rooftop system in Durban would have performed during every hour from 2000 to 2025. This historical performance profile reveals:
- Seasonal production variations between winter and summer months
- Diurnal patterns showing morning ramp-up and evening decline
- Impact of typical weather patterns on generation reliability
- Frequency and duration of low-production periods requiring backup or storage
This data directly informs battery energy storage system (BESS) sizing recommendations. For businesses implementing solar installations across Southern Africa, understanding when generation drops below consumption patterns determines optimal battery capacity and configuration.
Wind Resource Assessment
While solar dominates South African renewable discussions, wind power offers significant potential in coastal regions and highveld areas. The renewable ninja includes comprehensive wind simulation capabilities, allowing developers to model different turbine technologies at specific hub heights.
| Parameter | Configuration Options | Impact on Results |
|---|---|---|
| Turbine model | 20+ validated turbine types | Power curve characteristics |
| Hub height | 10m to 150m | Wind speed availability |
| Capacity | Custom MW rating | Scale of generation |
| Loss factor | Typical 10-15% | Real-world performance |
For a proposed wind project near Jeffrey's Bay, simulation using the renewable ninja reveals that optimal hub height selection can improve capacity factors by 3-5%, significantly affecting project economics over a 20-year operational period.
Integration with Energy Management Strategies
Beyond initial feasibility studies, the renewable ninja supports ongoing operational excellence through performance benchmarking and predictive maintenance planning. Commercial and industrial facilities increasingly require sophisticated energy management systems that optimize consumption patterns against variable renewable generation.
Load Matching and Storage Optimization
One of the most powerful applications involves matching simulated generation profiles against actual consumption data. By overlaying historical renewable ninja output with measured facility loads, energy managers identify:
- Self-consumption rates showing what percentage of generated power is used on-site
- Export opportunities indicating excess generation periods
- Storage requirements revealing gaps between generation and consumption
- Peak shaving potential demonstrating demand charge reduction opportunities
For a manufacturing facility in Gauteng, this analysis might reveal that without storage, only 45% of solar generation aligns with operational hours. Adding appropriate battery capacity increases self-consumption to 78%, dramatically improving project returns and energy resilience.
Financial Modelling Accuracy
Investment decisions for multi-million rand renewable installations demand precise financial projections. The renewable ninja enables developers to move beyond theoretical capacity factors toward validated, location-specific performance expectations.
By exporting hourly generation data and applying time-of-use tariff structures, analysts build detailed revenue models that account for:
- Seasonal tariff variations
- Peak/off-peak pricing differentials
- Export feed-in tariff rates (where applicable)
- Demand charge savings from peak shaving
This granular approach reveals that two solar systems with identical annual energy production might deliver vastly different financial outcomes based on when that energy is generated relative to consumption patterns and tariff structures.

API Access and Advanced Integration
For organizations managing multiple renewable projects or conducting repeated feasibility assessments, the Renewables.ninja API enables programmatic data retrieval and automated analysis workflows.
The API supports both solar PV and wind power simulations through RESTful endpoints. A typical Python implementation might retrieve 20 years of hourly solar data for a specific location in under 30 seconds:
Typical API Parameters
- Dataset: MERRA-2 or ERA5 (different temporal ranges)
- Latitude/Longitude: Precise project coordinates
- Date range: Historical period for simulation
- Capacity: System size in kW
- System loss: Typical 10-15% for real-world conditions
- Tilt and azimuth: Panel orientation parameters
- Tracking: Fixed, single-axis, or dual-axis configuration
Large renewable energy developers conducting provincial-scale resource assessments use the API to simulate hundreds of potential sites simultaneously, identifying optimal locations for utility-scale projects. Research applications demonstrate how renewable ninja data integrates into comprehensive energy system models.
Validation and Accuracy Considerations
No simulation tool perfectly replicates reality, and understanding the renewable ninja's limitations ensures appropriate application. The platform's developers have published extensive validation studies comparing simulated output against measured generation from real installations.
For solar PV, typical mean absolute errors range from 3-7% when comparing against ground truth data from monitoring systems. Wind simulations show larger variation, with accuracy heavily dependent on local topography and surrounding obstacles not captured in reanalysis datasets.
Factors Affecting Accuracy
Environmental variables not fully captured:
- Localized shading from nearby structures or vegetation
- Soiling accumulation on panels reducing output
- Snow or ice coverage (less relevant in South Africa)
- Extreme weather events causing temporary outages
Technical specifications requiring careful input:
- Inverter efficiency curves
- Temperature coefficient variations
- Degradation over system lifetime
- Module mismatch losses
Critical assessments, including validation research, note that renewable ninja performs best for initial feasibility and resource assessment rather than operational forecasting. For existing installations, combining renewable ninja historical context with real-time monitoring provides optimal insight.
Comparative Analysis and Benchmarking
Beyond individual project assessment, the renewable ninja enables competitive benchmarking across technologies, locations, and system configurations. This comparative capability proves particularly valuable when evaluating multiple potential sites or technology options.
Technology Comparison Example
| System Type | Location | Capacity Factor | Annual kWh/kW | Peak Month |
|---|---|---|---|---|
| Fixed tilt PV | Cape Town | 19.2% | 1,682 | December |
| Single-axis tracking | Cape Town | 24.1% | 2,111 | January |
| Fixed tilt PV | Johannesburg | 20.8% | 1,822 | November |
| Single-axis tracking | Johannesburg | 26.3% | 2,304 | December |
This data-driven comparison reveals that while tracking systems improve output by approximately 25% in both locations, Johannesburg's higher altitude and clearer winter skies deliver marginally better annual performance despite Cape Town's reputation for solar potential.
For European operators, the platform enables validation against actual generation data published by transmission system operators, building confidence in model accuracy.
Hybrid System Planning and Grid Integration
South Africa's evolving regulatory framework increasingly supports behind-the-meter generation and distributed renewable installations. The renewable ninja facilitates hybrid system design combining solar, wind, and storage to optimize energy independence and cost savings.
Complementary Generation Patterns
Wind and solar resources demonstrate complementary characteristics in many regions. Coastal areas experience strong evening winds precisely when solar generation declines, while winter months with reduced solar irradiance often bring better wind resources. By simulating both technologies using the renewable ninja, developers identify optimal hybrid configurations.
A Western Cape industrial facility might discover that combining 70% solar capacity with 30% wind capacity delivers more consistent baseload coverage than either technology alone, reducing required battery storage capacity by 35%.
For businesses exploring renewable energy integration strategies, this analysis informs technology selection and capacity allocation across multiple generation sources.
Data-Driven Decision Making for Net Zero Strategies
Corporate sustainability commitments increasingly drive renewable energy adoption across Southern Africa. Organizations pursuing Science Based Targets or Net Zero pledges require accurate emissions reduction quantification that renewable ninja data directly supports.
By modeling actual renewable generation against grid emission factors, sustainability teams calculate precise scope 2 emission reductions:
- Hourly grid displacement showing when renewable generation offsets fossil fuel consumption
- Annual carbon savings quantified in tonnes CO2e avoided
- Renewable energy certificates (RECs) quantification for sustainability reporting
- Progress tracking toward percentage renewable targets
This granular approach ensures sustainability claims withstand scrutiny from investors, regulators, and certification bodies. When combined with comprehensive renewable energy services, businesses accelerate decarbonization timelines while managing energy costs.
Professional Resources and Community Support
The renewable ninja represents a collaborative academic project hosted by institutions including Imperial College London and ETH Zürich. Project documentation from these institutions provides methodological transparency and ongoing research developments.
Users contribute to platform improvement through:
- Validation data sharing from operating installations
- Methodology discussions in academic publications
- Feature requests through community forums
- Case study contributions demonstrating practical applications
This open, research-driven approach ensures the renewable ninja evolves with industry needs while maintaining scientific rigor. For South African energy professionals, the platform provides international-standard analysis tools at no cost, democratizing access to sophisticated renewable resource assessment.
Implementation Best Practices
Maximizing value from the renewable ninja requires understanding both its capabilities and appropriate application contexts:
Initial feasibility assessments: Use platform data to screen potential sites and technologies before investing in detailed studies.
System sizing validation: Cross-reference renewable ninja output with manufacturer specifications and local installer experience.
Financial sensitivity analysis: Run multiple scenarios varying key parameters to understand project risk and opportunity ranges.
Performance monitoring baseline: Compare actual installation output against renewable ninja predictions to identify underperformance requiring maintenance or optimization.
Due diligence support: Provide independent generation estimates for lender or investor review processes.
Energy consultants conducting technical due diligence for project financiers regularly supplement renewable ninja analysis with on-site measurements, detailed shading studies, and equipment-specific modelling to refine accuracy for high-stakes investment decisions.
The renewable ninja platform has fundamentally changed how renewable energy professionals approach resource assessment, system design, and performance forecasting across South Africa and globally. By transforming decades of meteorological data into actionable generation insights, it enables evidence-based decision making that accelerates the energy transition while managing financial risk. Whether you're evaluating your first solar installation or optimizing a multi-technology renewable portfolio, INFOLED combines renewable ninja analytical capabilities with comprehensive engineering, installation, and monitoring services to deliver intelligent energy solutions tailored to Southern Africa's unique requirements and opportunities.
Next Step
Need help with your energy strategy?
Speak to INFOLED about solar, storage, EV charging, service agreements or system performance.